Note
Go to the end to download the full example code.
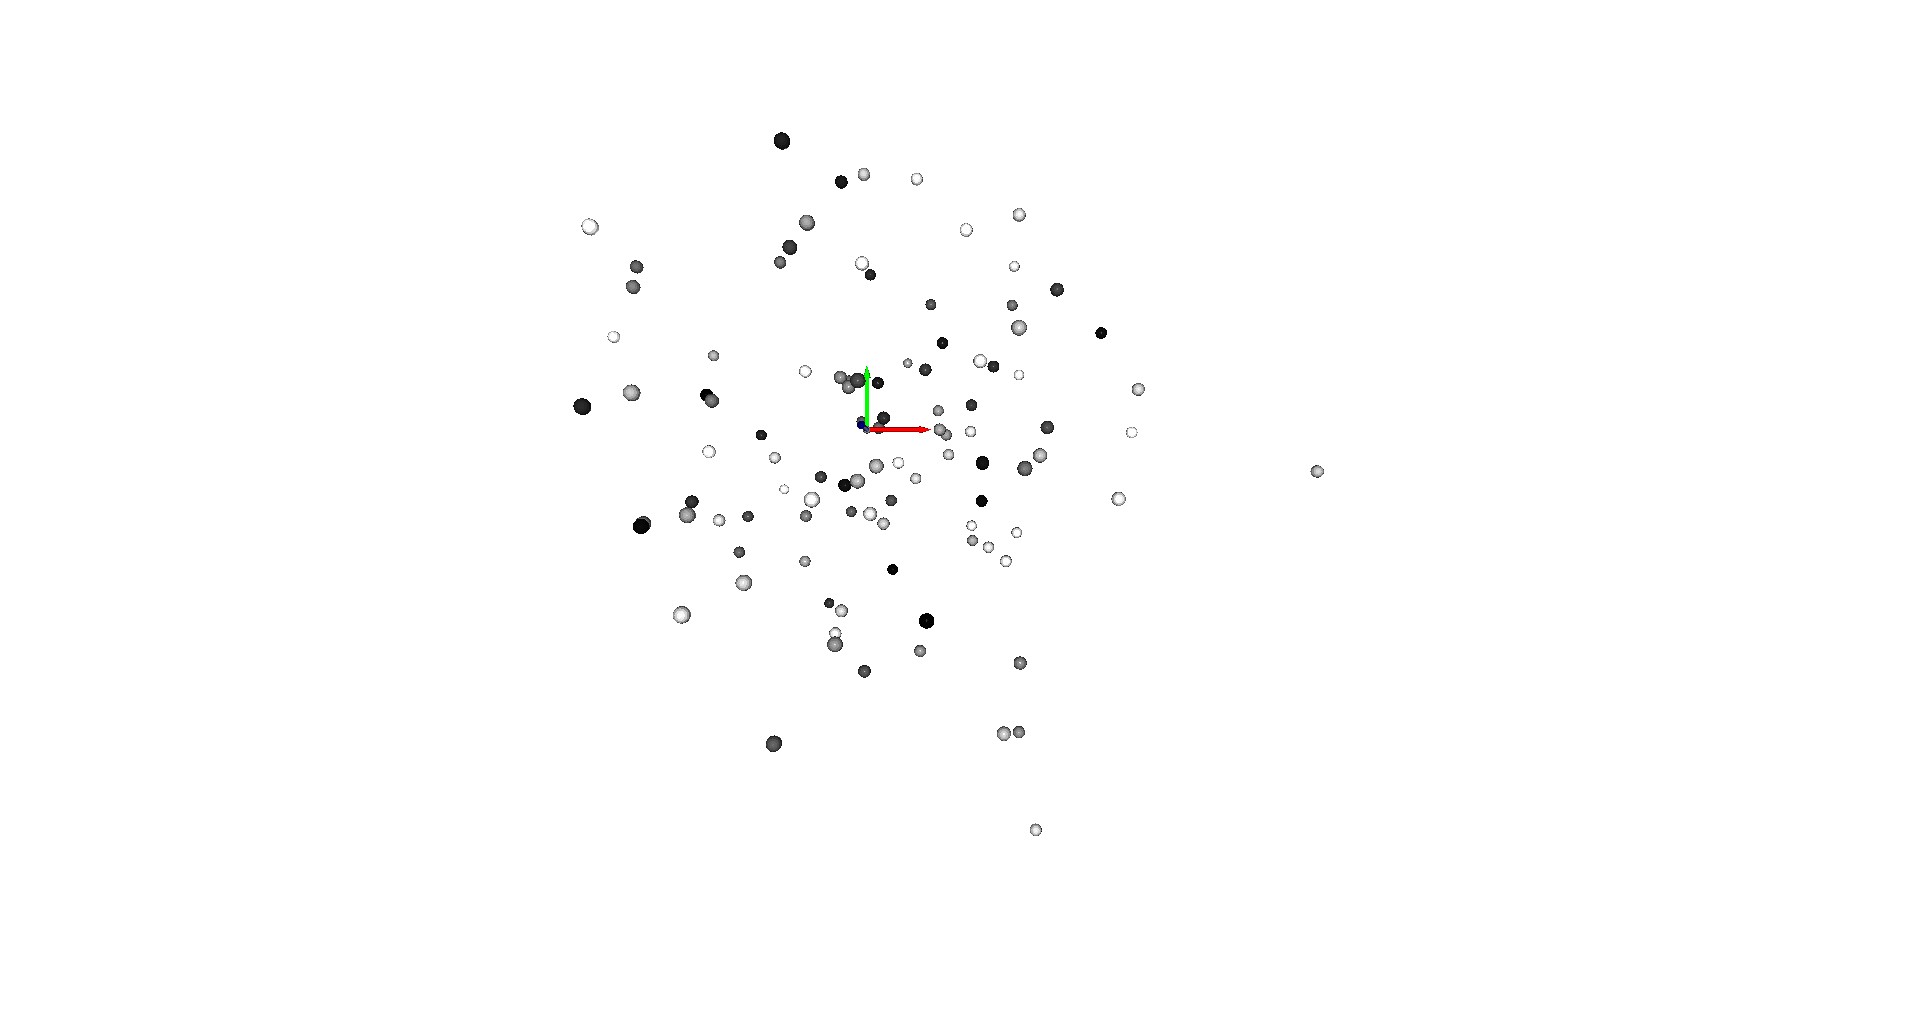
Scatter Plot#
Visualizes a point collection.
import numpy as np

import pytransform3d.visualizer as pv

fig = pv.figure()
rng = np.random.default_rng(41)
P = rng.standard_normal(size=(100, 3))
colors = np.empty((100, 3))
for d in range(colors.shape[1]):
    colors[:, d] = np.linspace(0, 1, len(colors))
fig.scatter(P, c=colors)
fig.plot_basis(R=np.eye(3), s=0.5)
fig.view_init()

if "__file__" in globals():
    fig.show()
else:
    fig.save_image("__open3d_rendered_image.jpg")
Total running time of the script: (0 minutes 0.224 seconds)