Note
Go to the end to download the full example code.
Plot Multiple Spheres#
Benchmarks plotting of multiple spheres at once and compares it to plotting each sphere individually.
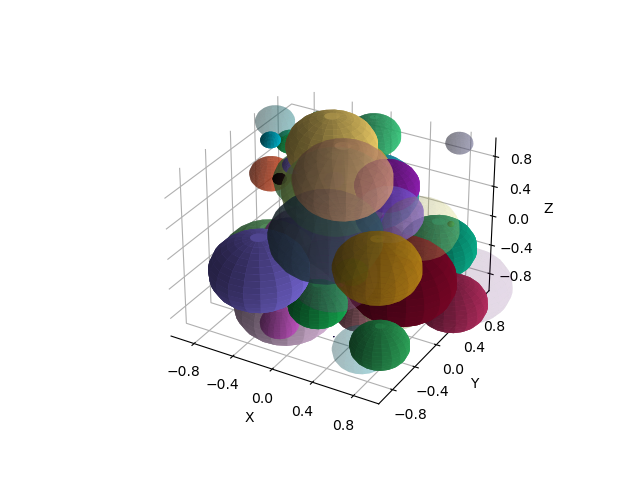
n_spheres       single                  multi                   speedup
50              0.07862544059753418     0.05806994438171387     1.3539782315047852
import time

import matplotlib.pyplot as plt
import numpy as np

from pytransform3d.plot_utils import plot_sphere, plot_spheres

n_spheres = 50
random_state = np.random.default_rng(0)
P = 2 * random_state.random((n_spheres, 3)) - 1
radii = random_state.random(n_spheres) / 2
colors = random_state.random((n_spheres, 3))
alphas = random_state.random(n_spheres)

start = time.time()
plot_spheres(p=P, radius=radii, color=colors, alpha=alphas, wireframe=False)
end = time.time()
time_multi = end - start

start = time.time()
for p, radius, color, alpha in zip(P, radii, colors, alphas):
    plot_sphere(p=p, radius=radius, color=color, alpha=alpha, wireframe=False)
end = time.time()
time_single = end - start

speedup = time_single / time_multi

print("n_spheres", "single", "\t", "multi", "\t", "speedup", sep="\t")
print(n_spheres, "", time_single, time_multi, speedup, sep="\t")

plt.show()
Total running time of the script: (0 minutes 1.940 seconds)