Note
Go to the end to download the full example code.
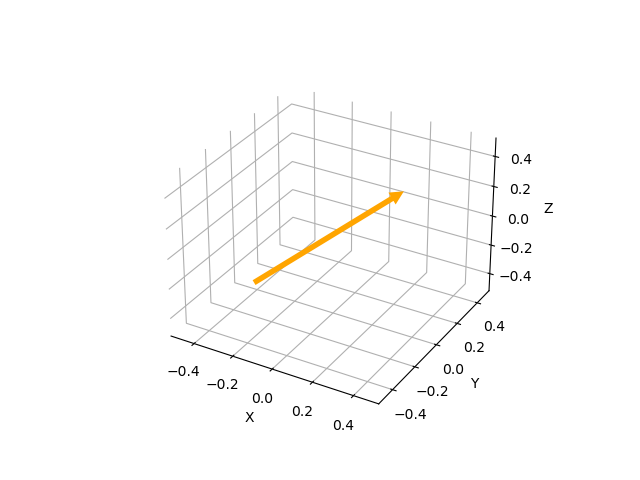
Plot Vector#

import matplotlib.pyplot as plt
import numpy as np

from pytransform3d.plot_utils import plot_vector

plot_vector(
    # A vector is defined by start, direction, and s (scaling)
    start=np.array([-0.3, -0.2, -0.3]),
    direction=np.array([1.0, 1.0, 1.0]),
    s=0.5,
    ax_s=0.5,  # Scaling of 3D axes
    lw=0,  # Remove line around arrow
    color="orange",
)
plt.show()
Total running time of the script: (0 minutes 0.047 seconds)
