Note
Go to the end to download the full example code.
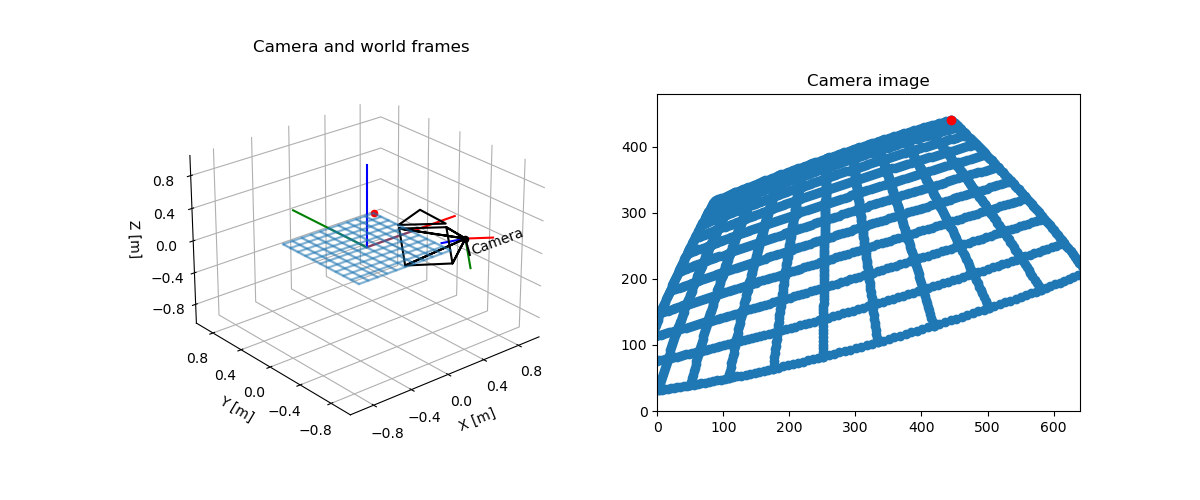
Camera Transform#
We can see the camera frame and the world frame. There is a grid of points from which we know the world coordinates. If we know the location and orientation of the camera in the world, we can easily compute the location of the points on the image.
/home/dfki.uni-bremen.de/afabisch/Projekte/pytransform3d/examples/plots/plot_camera_with_image.py:21: DeprecationWarning: function is deprecated, use matrix_from_euler
  active_matrix_from_intrinsic_euler_xyz([-np.pi + 1, -0.1, 0.3]),
import matplotlib.pyplot as plt
import numpy as np

from pytransform3d.camera import make_world_grid, world2image, plot_camera
from pytransform3d.plot_utils import make_3d_axis
from pytransform3d.rotations import active_matrix_from_intrinsic_euler_xyz
from pytransform3d.transformations import transform_from, plot_transform

cam2world = transform_from(
    active_matrix_from_intrinsic_euler_xyz([-np.pi + 1, -0.1, 0.3]),
    [0.2, -1, 0.5],
)
focal_length = 0.0036
sensor_size = (0.00367, 0.00274)
image_size = (640, 480)
intrinsic_camera_matrix = np.array(
    [
        [focal_length, 0, sensor_size[0] / 2],
        [0, focal_length, sensor_size[1] / 2],
        [0, 0, 1],
    ]
)

world_grid = make_world_grid(n_points_per_line=101)
image_grid = world2image(
    world_grid, cam2world, sensor_size, image_size, focal_length, kappa=0.4
)

plt.figure(figsize=(12, 5))
ax = make_3d_axis(1, 121, unit="m")
ax.view_init(elev=30, azim=-70)
plot_transform(ax)
plot_transform(ax, A2B=cam2world, s=0.3, name="Camera")
plot_camera(
    ax,
    intrinsic_camera_matrix,
    cam2world,
    sensor_size=sensor_size,
    virtual_image_distance=0.5,
)
ax.set_title("Camera and world frames")
ax.scatter(world_grid[:, 0], world_grid[:, 1], world_grid[:, 2], s=1, alpha=0.2)
ax.scatter(world_grid[-1, 0], world_grid[-1, 1], world_grid[-1, 2], color="r")
ax.view_init(elev=25, azim=-130)

ax = plt.subplot(122, aspect="equal")
ax.set_title("Camera image")
ax.set_xlim(0, image_size[0])
ax.set_ylim(0, image_size[1])
ax.scatter(image_grid[:, 0], -(image_grid[:, 1] - image_size[1]))
ax.scatter(image_grid[-1, 0], -(image_grid[-1, 1] - image_size[1]), color="r")

plt.show()
Total running time of the script: (0 minutes 0.133 seconds)