Note
Go to the end to download the full example code.
Plot Box#

import matplotlib.pyplot as plt
import numpy as np

from pytransform3d.plot_utils import (
    plot_box,
    plot_length_variable,
    remove_frame,
)
from pytransform3d.transformations import plot_transform

plt.figure()
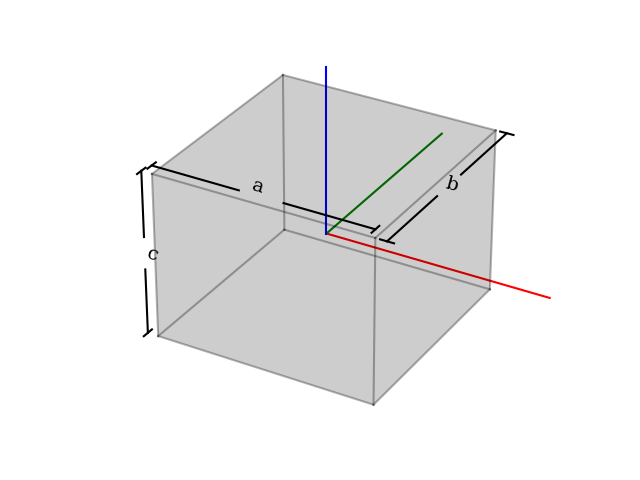
ax = plot_box(size=[1, 1, 1], wireframe=False, alpha=0.1, color="k", ax_s=0.6)
plot_transform(ax=ax)
plot_box(ax=ax, size=[1, 1, 1], wireframe=True, alpha=0.3)
plot_length_variable(
    ax=ax,
    start=np.array([-0.5, -0.5, 0.55]),
    end=np.array([0.5, -0.5, 0.55]),
    name="a",
    fontsize=14,
    fontfamily="serif",
)
plot_length_variable(
    ax=ax,
    start=np.array([0.55, -0.5, 0.5]),
    end=np.array([0.55, 0.5, 0.5]),
    name="b",
    fontsize=14,
    fontfamily="serif",
)
plot_length_variable(
    ax=ax,
    start=np.array([-0.55, -0.5, -0.5]),
    end=np.array([-0.55, -0.5, 0.5]),
    name="c",
    fontsize=14,
    fontfamily="serif",
)
remove_frame(ax)
plt.show()
Total running time of the script: (0 minutes 0.053 seconds)
