pytransform3d.plot_utils.plot_sphere#
- pytransform3d.plot_utils.plot_sphere(ax=None, radius=1.0, p=array([0., 0., 0.]), ax_s=1, wireframe=True, n_steps=20, alpha=1.0, color='k', linewidth=1.0)[source]#
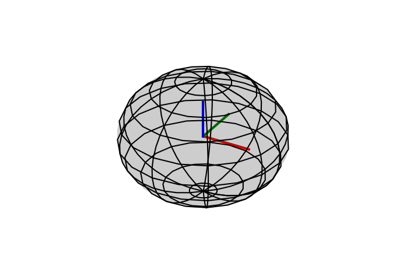
Plot sphere.
- Parameters:
- axMatplotlib 3d axis, optional (default: None)
If the axis is None, a new 3d axis will be created
- radiusfloat, optional (default: 1)
Radius of the sphere
- parray-like, shape (3,), optional (default: [0, 0, 0])
Center of the sphere
- ax_sfloat, optional (default: 1)
Scaling of the new matplotlib 3d axis
- wireframebool, optional (default: True)
Plot wireframe of sphere and surface otherwise
- n_stepsint, optional (default: 20)
Number of discrete steps plotted in each dimension
- alphafloat, optional (default: 1)
Alpha value of the sphere that will be plotted
- colorstr, optional (default: black)
Color in which the sphere should be plotted
- linewidthfloat, optional (default: 1.0)
Line width for wireframe plot
- Returns:
- axMatplotlib 3d axis
New or old axis