Note
Go to the end to download the full example code.
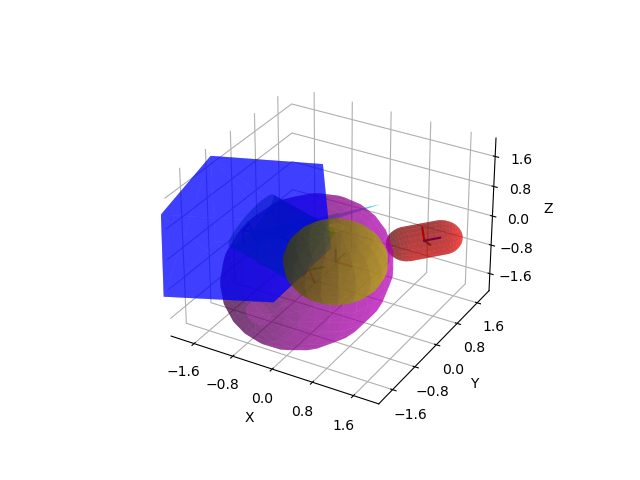
Plot Random Geometries#
Plotting of several geometric shapes is directly supported by the library.
import matplotlib.pyplot as plt
import numpy as np

from pytransform3d.plot_utils import (
    make_3d_axis,
    plot_box,
    plot_sphere,
    plot_cylinder,
    plot_ellipsoid,
    plot_capsule,
    plot_cone,
)
from pytransform3d.transformations import (
    random_transform,
    plot_transform,
    translate_transform,
)

rng = np.random.default_rng(2832)
A box is defined by its size along the three main axes and its pose.
box2origin = random_transform(rng)
box_size = rng.random(size=3) * 3
A sphere is defined by its position and radius.
sphere_position = rng.standard_normal(size=3)
sphere_radius = float(rng.random())
A cylinder is defined by its length, radius, and pose.
cylinder2origin = random_transform(rng)
length = float(rng.random()) * 5
cylinder_radius = float(rng.random())
An ellipsoid is defined by its 3 radii and pose.
ellipsoid2origin = random_transform(rng)
radii = rng.random(size=3) * 3
A capsule is defined by its height, radius, and pose.
capsule2origin = random_transform(rng)
capsule_height = float(rng.random()) * 2
capsule_radius = float(rng.random())
A cone is defined by its height, radius, and pose.
cone2origin = random_transform(rng)
cone_height = float(rng.random()) * 5
cone_radius = float(rng.random())
The following part shows pytransform3d’s 3D plotting functions.
ax = make_3d_axis(2)

plot_transform(ax=ax, A2B=box2origin, s=0.3)
plot_box(
    ax=ax, A2B=box2origin, size=box_size, color="b", alpha=0.5, wireframe=False
)

plot_transform(
    ax=ax, A2B=translate_transform(np.eye(4), sphere_position), s=0.3
)
plot_sphere(
    ax=ax,
    p=sphere_position,
    radius=sphere_radius,
    color="y",
    alpha=0.5,
    wireframe=False,
)

plot_transform(ax=ax, A2B=cylinder2origin, s=0.3)
plot_cylinder(
    ax=ax,
    A2B=cylinder2origin,
    length=length,
    radius=cylinder_radius,
    color="g",
    alpha=0.5,
    wireframe=False,
)

plot_transform(ax=ax, A2B=ellipsoid2origin, s=0.3)
plot_ellipsoid(
    ax=ax,
    A2B=ellipsoid2origin,
    radii=radii,
    color="m",
    alpha=0.5,
    wireframe=False,
)

plot_transform(ax=ax, A2B=capsule2origin, s=0.3)
plot_capsule(
    ax=ax,
    A2B=capsule2origin,
    height=capsule_height,
    radius=capsule_radius,
    color="r",
    alpha=0.5,
    wireframe=False,
)

plot_transform(ax=ax, A2B=cone2origin, s=0.3)
plot_cone(
    ax=ax,
    A2B=cone2origin,
    height=cone_height,
    radius=cone_radius,
    color="c",
    alpha=0.5,
    wireframe=False,
)

plt.show()
Total running time of the script: (0 minutes 0.124 seconds)