Note
Go to the end to download the full example code.
Camera Projection#
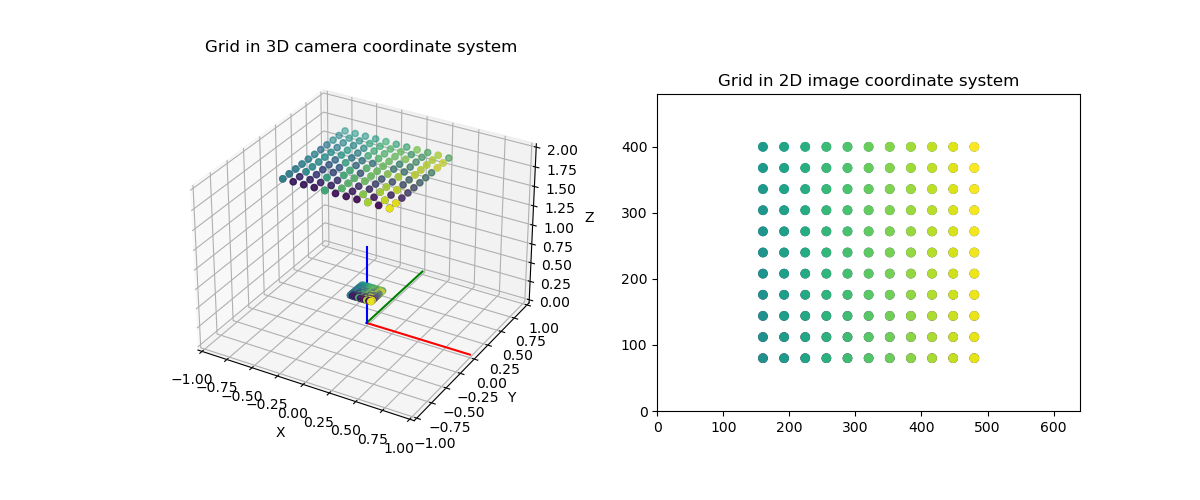
We can see the camera coordinate frame and a grid of points in the camera coordinate system which will be projected to the sensor. From the coordinates on the sensor we can compute the corresponding pixels.
import matplotlib.pyplot as plt
import numpy as np

from pytransform3d.camera import make_world_grid, cam2sensor, sensor2img
from pytransform3d.transformations import plot_transform
Camera Details#
We have to define the focal length and sensor size of the camera in meters as well as the image size in pixels. The sensor size is extraordinarily large so that we can see it.
focal_length = 0.2
sensor_size = (0.2, 0.15)
image_size = (640, 480)
Grid#
We define a grid in 3D world coordinates and compute its projection to the sensor in 3D.
cam_grid = make_world_grid(n_points_per_line=11) - np.array([0, 0, -2, 0])
img_grid_3d = cam_grid * focal_length
Projection#
First, we project the grid from its original 3D coordinates to its projection on the sensor, then we convert it to image coordinates.
Plotting#
Now we can plot the grid in 3D, projected to the 3D sensor, and projected to the image.
plt.figure(figsize=(12, 5))
ax = plt.subplot(121, projection="3d")
ax.set_title("Grid in 3D camera coordinate system")
ax.set_xlim((-1, 1))
ax.set_ylim((-1, 1))
ax.set_zlim((0, 2))
ax.set_xlabel("X")
ax.set_ylabel("Y")
ax.set_zlabel("Z")
c = np.arange(len(cam_grid))
ax.scatter(cam_grid[:, 0], cam_grid[:, 1], cam_grid[:, 2], c=c)
ax.scatter(img_grid_3d[:, 0], img_grid_3d[:, 1], img_grid_3d[:, 2], c=c)
plot_transform(ax)

ax = plt.subplot(122, aspect="equal")
ax.set_title("Grid in 2D image coordinate system")
ax.scatter(img_grid[:, 0], img_grid[:, 1], c=c)
ax.set_xlim((0, image_size[0]))
ax.set_ylim((0, image_size[1]))

plt.show()

Total running time of the script: (0 minutes 0.122 seconds)
