pytransform3d.plot_utils.plot_vector#
- pytransform3d.plot_utils.plot_vector(ax=None, start=array([0., 0., 0.]), direction=array([1, 0, 0]), s=1.0, arrowstyle='simple', ax_s=1, **kwargs)[source]#
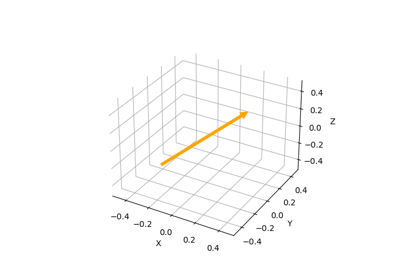
Plot Vector.
Draws an arrow from start to start + s * direction.
- Parameters:
- axMatplotlib 3d axis, optional (default: None)
If the axis is None, a new 3d axis will be created
- startarray-like, shape (3,), optional (default: [0, 0, 0])
Start of the vector
- directionarray-like, shape (3,), optional (default: [1, 0, 0])
Direction of the vector
- sfloat, optional (default: 1)
Scaling of the vector that will be drawn
- arrowstylestr, or ArrowStyle, optional (default: ‘simple’)
See matplotlib’s documentation of arrowstyle in matplotlib.patches.FancyArrowPatch for more options
- ax_sfloat, optional (default: 1)
Scaling of the new matplotlib 3d axis
- kwargsdict, optional (default: {})
Additional arguments for the plotting functions, e.g. alpha
- Returns:
- axMatplotlib 3d axis
New or old axis
Examples using pytransform3d.plot_utils.plot_vector#
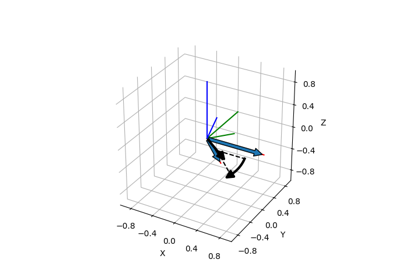
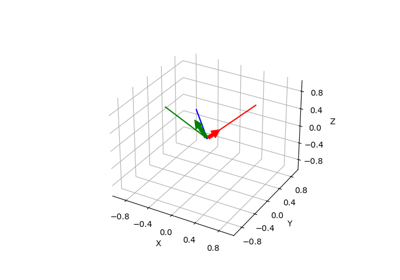
Axis-Angle Representation from Two Direction Vectors
Axis-Angle Representation from Two Direction Vectors