pytransform3d.plot_utils.plot_length_variable#
- pytransform3d.plot_utils.plot_length_variable(ax=None, start=array([0., 0., 0.]), end=array([1., 1., 1.]), name='l', above=False, ax_s=1, color='k', **kwargs)[source]#
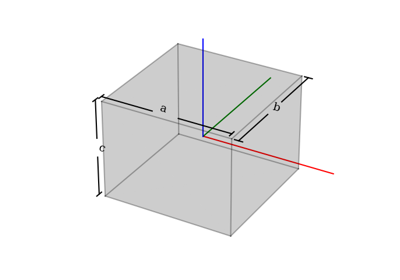
Plot length with text at its center.
- Parameters:
- axMatplotlib 3d axis, optional (default: None)
If the axis is None, a new 3d axis will be created
- startarray-like, shape (3,), optional (default: [0, 0, 0])
Start point
- endarray-like, shape (3,), optional (default: [1, 1, 1])
End point
- namestr, optional (default: ‘l’)
Text in the middle
- abovebool, optional (default: False)
Plot name above line
- ax_sfloat, optional (default: 1)
Scaling of the new matplotlib 3d axis
- colorstr, optional (default: black)
Color in which the cylinder should be plotted
- kwargsdict, optional (default: {})
Additional arguments for the text, e.g. fontsize
- Returns:
- axMatplotlib 3d axis
New or old axis