pytransform3d.plot_utils.plot_cylinder#
- pytransform3d.plot_utils.plot_cylinder(ax=None, length=1.0, radius=1.0, thickness=0.0, A2B=array([[1., 0., 0., 0.], [0., 1., 0., 0.], [0., 0., 1., 0.], [0., 0., 0., 1.]]), ax_s=1, wireframe=True, n_steps=100, alpha=1.0, color='k', linewidth=1.0)[source]#
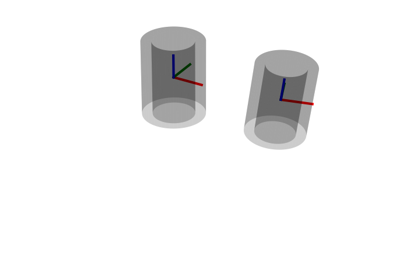
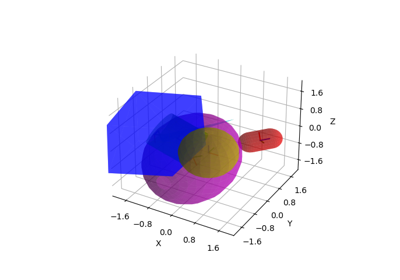
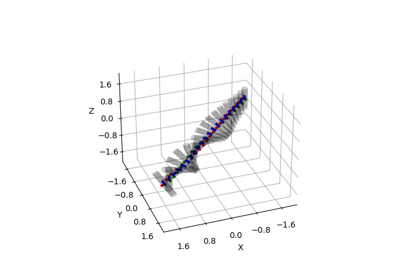
Plot cylinder.
A cylinder is the volume covered by a disk moving along a line segment.
- Parameters:
- axMatplotlib 3d axis, optional (default: None)
If the axis is None, a new 3d axis will be created
- lengthfloat, optional (default: 1)
Length of the cylinder
- radiusfloat, optional (default: 1)
Radius of the cylinder
- thicknessfloat, optional (default: 0)
Thickness of a cylindrical shell. It will be subtracted from the outer radius to obtain the inner radius. The difference must be greater than 0.
- A2Barray-like, shape (4, 4)
Center of the cylinder
- ax_sfloat, optional (default: 1)
Scaling of the new matplotlib 3d axis
- wireframebool, optional (default: True)
Plot wireframe of cylinder and surface otherwise
- n_stepsint, optional (default: 100)
Number of discrete steps plotted in each dimension
- alphafloat, optional (default: 1)
Alpha value of the cylinder that will be plotted
- colorstr, optional (default: black)
Color in which the cylinder should be plotted
- linewidthfloat, optional (default: 1.0)
Line width for wireframe plot
- Returns:
- axMatplotlib 3d axis
New or old axis
- Raises:
- ValueError
If thickness is <= 0