pytransform3d.rotations.plot_bivector#
- pytransform3d.rotations.plot_bivector(ax=None, a=None, b=None, ax_s=1)[source]#
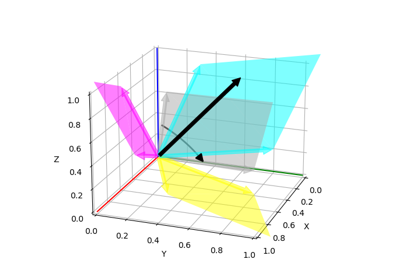
Plot bivector from wedge product of two vectors a and b.
The two vectors will be displayed in grey together with the parallelogram that they form. Each component of the bivector corresponds to the area of the parallelogram projected on the basis planes. These parallelograms will be shown as well. Furthermore, one black arrow will show the rotation direction of the bivector and one black arrow will represent the normal of the plane that can be extracted by rearranging the elements of the bivector and normalizing the vector.
- Parameters:
- axMatplotlib 3d axis, optional (default: None)
If the axis is None, a new 3d axis will be created
- aarray-like, shape (3,), optional (default: [1, 0, 0])
Vector
- barray-like, shape (3,), optional (default: [0, 1, 0])
Vector
- ax_sfloat, optional (default: 1)
Scaling of the new matplotlib 3d axis
- Returns:
- axMatplotlib 3d axis
New or old axis