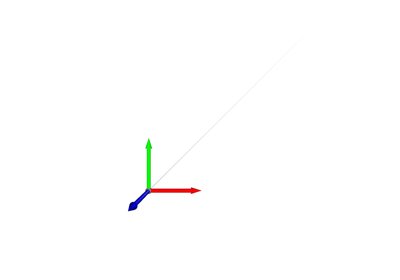
pytransform3d.visualizer.Line3D#
- class pytransform3d.visualizer.Line3D(P, c=(0, 0, 0))[source]#
Bases:
ArtistA line.
- Parameters:
- Parray-like, shape (n_points, 3)
Points of which the line consists.
- carray-like, shape (n_points - 1, 3) or (3,), optional (default: black)
Color can be given as individual colors per line segment or as one color for each segment. A color is represented by 3 values between 0 and 1 indicate representing red, green, and blue respectively.
Methods
__init__(P[, c])add_artist(figure)Add artist to figure.
set_data(P[, c])Update data.
Attributes
Expose geometries.
- set_data(P, c=None)[source]#
Update data.
- Parameters:
- Parray-like, shape (n_points, 3)
Points of which the line consists.
- carray-like, shape (n_points - 1, 3) or (3,), optional (default: black)
Color can be given as individual colors per line segment or as one color for each segment. A color is represented by 3 values between 0 and 1 indicate representing red, green, and blue respectively.
- property geometries#
Expose geometries.
- Returns:
- geometrieslist
List of geometries that can be added to the visualizer.
- add_artist(figure)#
Add artist to figure.
- Parameters:
- figureFigure
Figure to which the artist will be added.

