pytransform3d.plot_utils.Trajectory#
- class pytransform3d.plot_utils.Trajectory(H, show_direction=True, n_frames=10, s=1.0, **kwargs)[source]#
Bases:
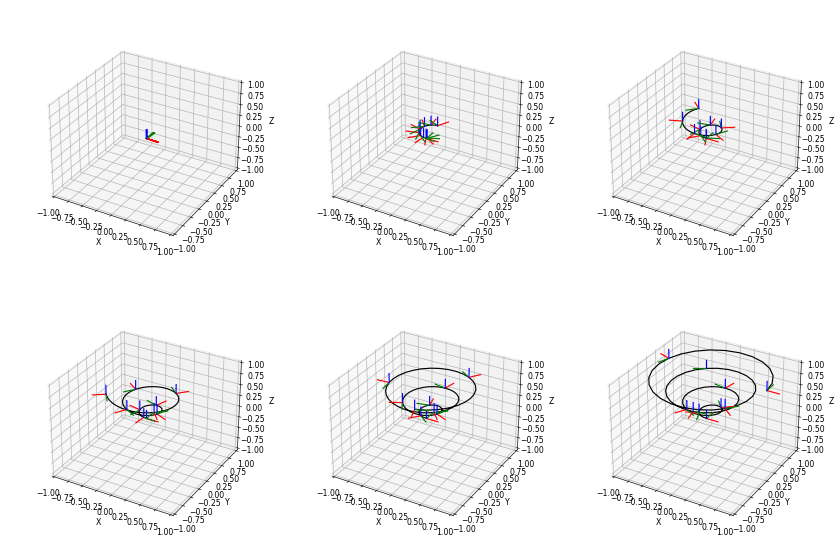
ArtistA Matplotlib artist that displays a trajectory.
- Parameters:
- Harray-like, shape (n_steps, 4, 4)
Sequence of poses represented by homogeneous matrices
- show_directionbool, optional (default: True)
Plot an arrow to indicate the direction of the trajectory
- n_framesint, optional (default: 10)
Number of frames that should be plotted to indicate the rotation
- sfloat, optional (default: 1)
Scaling of the frames that will be drawn
- Other arguments are passed onto Line3D.
Methods
__init__(H[, show_direction, n_frames, s])add_trajectory(axis)Add the trajectory to a 3D axis.
draw(renderer, *args, **kwargs)Draw the artist.
set(*[, agg_filter, alpha, animated, ...])Set multiple properties at once.
set_data(H)Set the trajectory data.
Attributes
- set_data(H)[source]#
Set the trajectory data.
- Parameters:
- Harray-like, shape (n_steps, 4, 4)
Sequence of poses represented by homogeneous matrices
- set(*, agg_filter=<UNSET>, alpha=<UNSET>, animated=<UNSET>, clip_box=<UNSET>, clip_on=<UNSET>, clip_path=<UNSET>, data=<UNSET>, gid=<UNSET>, in_layout=<UNSET>, label=<UNSET>, mouseover=<UNSET>, path_effects=<UNSET>, picker=<UNSET>, rasterized=<UNSET>, sketch_params=<UNSET>, snap=<UNSET>, transform=<UNSET>, url=<UNSET>, visible=<UNSET>, zorder=<UNSET>)#
Set multiple properties at once.
Supported properties are
- Properties:
agg_filter: a filter function, which takes a (m, n, 3) float array and a dpi value, and returns a (m, n, 3) array and two offsets from the bottom left corner of the image alpha: float or None animated: bool clip_box: ~matplotlib.transforms.BboxBase or None clip_on: bool clip_path: Patch or (Path, Transform) or None data: array-like, shape (n_steps, 4, 4) figure: ~matplotlib.figure.Figure or ~matplotlib.figure.SubFigure gid: str in_layout: bool label: object mouseover: bool path_effects: list of .AbstractPathEffect picker: None or bool or float or callable rasterized: bool sketch_params: (scale: float, length: float, randomness: float) snap: bool or None transform: ~matplotlib.transforms.Transform url: str visible: bool zorder: float


