pytransform3d.uncertainty.plot_projected_ellipsoid#
- pytransform3d.uncertainty.plot_projected_ellipsoid(ax, mean, cov, factor=1.96, wireframe=True, n_steps=20, color=None, alpha=1.0)[source]#
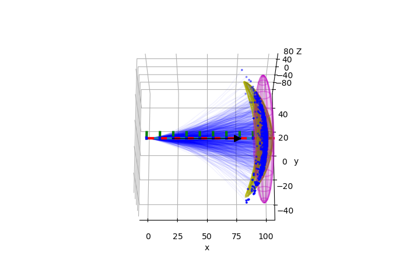
Plots projected equiprobable ellipsoid in 3D.
An error ellipsoid shows equiprobable points. This is a projection of a Gaussian distribution in exponential coordinate space to 3D.
- Parameters:
- axaxis
Matplotlib axis.
- meanarray-like, shape (4, 4)
Mean pose.
- covarray-like, shape (6, 6)
Covariance in exponential coordinate space.
- factorfloat, optional (default: 1.96)
Multiple of the standard deviations that should be plotted.
- wireframebool, optional (default: True)
Plot wireframe of ellipsoid and surface otherwise.
- n_stepsint, optional (default: 20)
Number of discrete steps plotted in each dimension.
- colorstr, optional (default: None)
Color in which the equiprobably lines should be plotted.
- alphafloat, optional (default: 1.0)
Alpha value for lines.
- Returns:
- axaxis
Matplotlib axis.

